PennFuture Blog
Our Perspectives on the Latest Issues
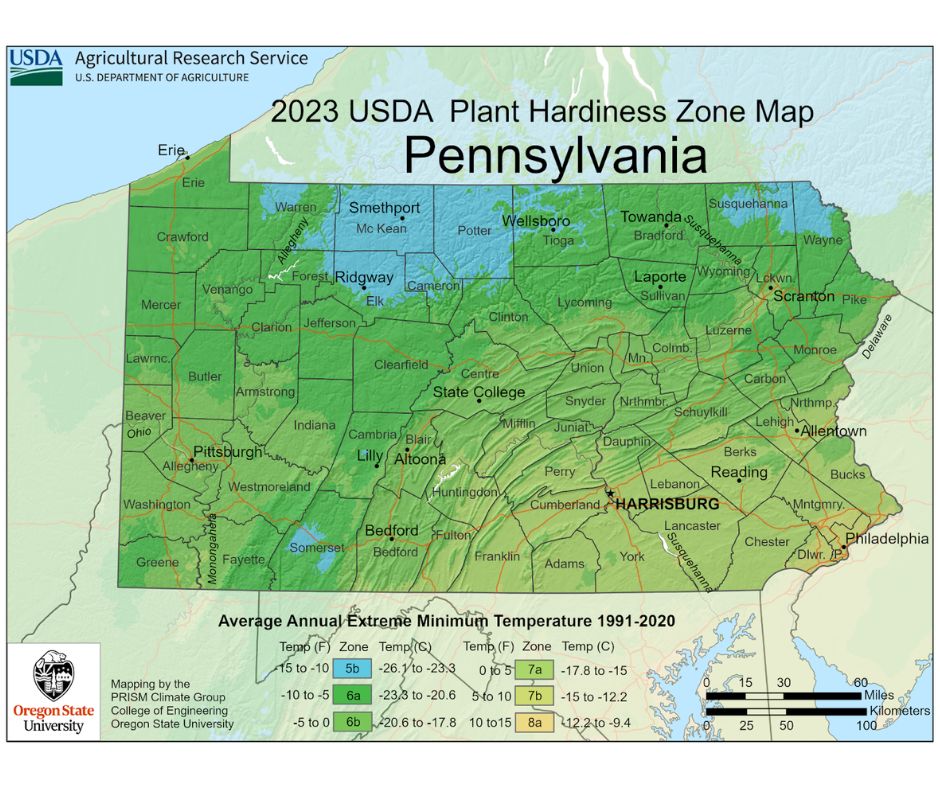
This month, the USDA released the first update to its Plant Hardiness Zone Map in more than a decade, providing a stark, full-color depiction of the progress of climate change.
The USDA Plant Hardiness Zone Map divides the country into thirteen hardiness zones based on the annual extreme minimum winter temperature at each location. The extreme minimum winter temperature reflects the average of the coldest temperature reached in a location for each year over a specified time period and provides a reasonable estimate of the lowest temperature one can expect at that location each year. Each hardiness zone covers ten degrees Fahrenheit and is broken into two five-degree half-zones (e.g. zone 5 is divided it half-zones 5a and 5b). Gardeners and growers use this information to determine which perennial plants are likely to thrive at a location, and the USDA Risk Management Agency uses it to set crop insurance standards. Scientists also use this data to model the spread of exotic weeds and insects.
The 2023 map is based on the average lowest annual winter temperature for the 30-year period from 1991 to 2020 and incorporates data from more than 13,412 weather stations nationwide. Compared to earlier versions of the map, the 2023 map shows that many hardiness zones have shifted significantly over time. In fact, between 2012 and 2023, about half the country, including much of Pennsylvania, has shifted a half-zone warmer. For example, the 2012 map, based on data from 1976 to 2005, places nearly all of Lancaster County in Zone 6b, with an average extreme minimum winter temperature between -5 °F and 0 °F . The new 2023 map shows that the average extreme minimum winter temperature in Lancaster County is now five degrees warmer, placing the county in Zone 7a. Harrisburg, Erie, Scranton, Reading, the Poconos, and much of southwest PA similarly have shifted a half-zone warmer from their 2012 zones.
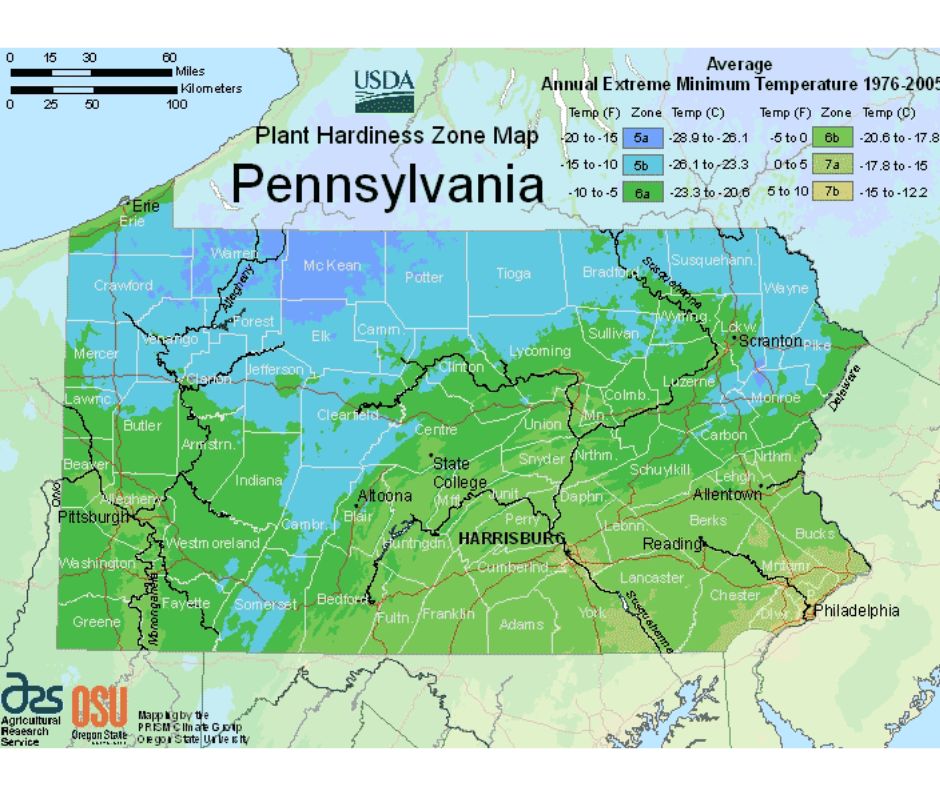
Comparing the 2023 map to the 1990 map, which is based on data from 1974 to 1986, (link here: Pennsylvania Interactive 1990 USDA Plant Hardiness Zone Map) shows an even more dramatic shift. In 1990, approximately half the Commonwealth fell into Zones 4b or 5, with average extreme minimum temperature ranging from -25 °F to -10 °F. Now, only a small portion of the northernmost counties remains in Zone 5b, and no part of the Commonwealth remains in Zone 5a or 4b. This means not only that the coldest temperature one can expect to experience anywhere in Pennsylvania is now ten degrees warmer than it was in 1990, but that the portion of the Commonwealth that will experience these cold temperatures is severely reduced.
While home gardeners may welcome the extended growing season that comes with warmer weather, this data signals trouble for some native plants. A number of native plant species such as balsam fir, and bog laurel and creeping snowberry are already at the far southern fringe of their remaining habitat in Pennsylvania. Research by the Pennsylvania Natural Heritage Program has designated these and more than a dozen other native plant species as “extremely vulnerable” to warming temperatures. Many of these species, including the white-fringed orchid, the leafy bog aster, bog rosemary, and Labrador tea grow only in bog or wetland habitats that are highly vulnerable to loss or reduction with climate changes..
Warmer temperatures also allow invasive insect species that prey on native plants to thrive. For example, the emerald ash borer is an invasive insect that poses a serious threat to the 308 million ash trees in Pennsylvania forests. Cold temperatures help reduce the number of emerald ash borer larvae that survive the winter, but significant larvae die off does not occur until temperatures fall to -10 °F. The 2023 Plant Hardiness Zones Map indicates that the portion of Pennsylvania that can expect to experience temperatures this low has shrunk dramatically since 2012.
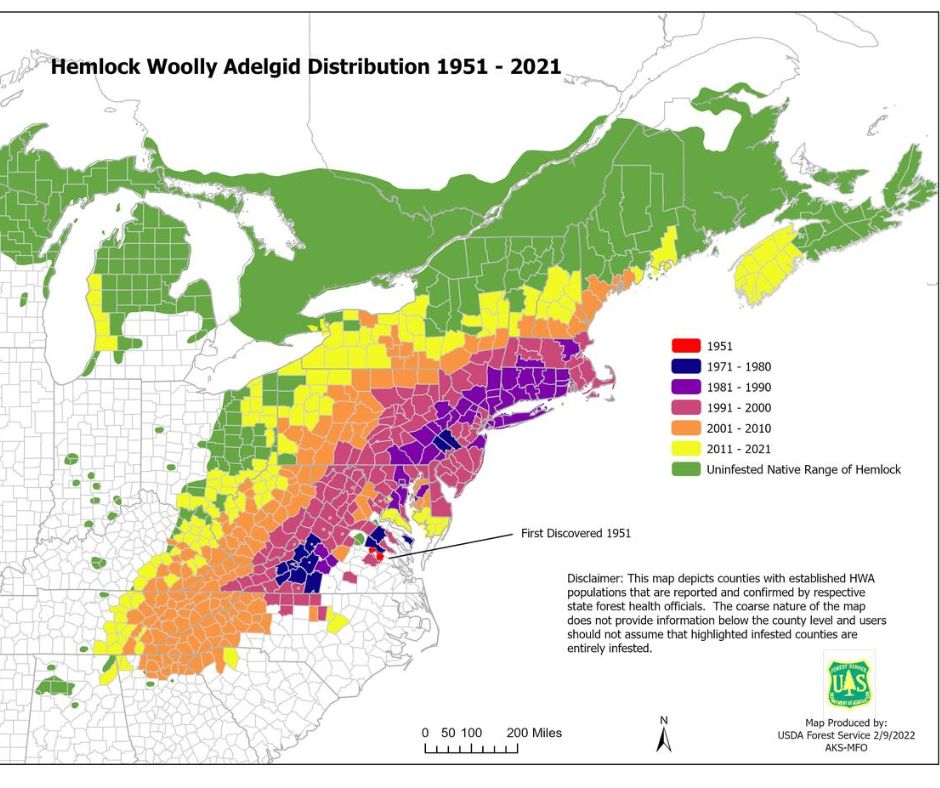
Similarly, low winter temperature has a dynamic role in impacting the range and population of the hemlock woolly adelgid, an invasive insect that has infected, weakened, and killed an enormous number of the Pennsylvania state tree, the eastern hemlock. The destruction of hemlocks by this pest has greatly affected Pennsylvania’s forest habitats and streams by reducing shelter for wildlife and warming unshaded streams. This, in turn, threatens aquatic species that depend on cooler water such as brook trout, rainbow trout, and the eastern hellbender. Like the emerald ash borer, hemlock woolly adelgids can survive subfreezing temperatures, but their survival rate drops off significantly once temperatures dip below zero, and most will die when temperatures reach -10 °F. As the map below illustrates, as fewer locations experience the extreme cold necessary to keep the population in check, the woolly adelgid’s range creeps ever northward, threatening more of these beautiful emblems of Pennsylvania’s natural beauty and diversity.
The threat posed to our native plant species and the ecosystems they support is just one of the reasons that PennFuture is committed to combating and mitigating the impacts of the climate crisis by reducing greenhouse gas emissions, building resilient communities, and forging a just and equitable clean energy economy in Pennsylvania. Support our work by becoming a PennFuture member today!
More by this contributor:
BLOG SEARCH
LATEST BLOG POSTS
Get the Latest onOur PennFuture
Sign up for email updates on the latest news, events, and opportunities to make a difference.